

Recently, Federal Reserve Chairman Jerome Powell and the Federal Open Market Committee decided to cut interest rates by 50 basis points. This move marks a significant shift in policy following a historic cycle of rate hikes aimed at curbing inflation. After 30 months of aggressive rate increases and maintaining restrictive levels, this cut indicates that the Fed sees inflation receding and is now focused on supporting economic growth.
The Federal Reserve’s decisions play a pivotal role in shaping the U.S. economy, particularly the stock market. A rate cut can signal changing economic conditions, as it is often intended to stimulate activity when growth slows or when the economy begins to show stress. But how do these policy shifts impact stock markets, and what could investors expect?
S&P 500 Returns After Rate Cuts
To understand the potential outcomes of this rate cut, we can look at historical data. The table below highlights the S&P 500’s price performance since 1960 following initial rate cuts, while the accompanying chart illustrates the index’s price history over the same timeframe, indicating recessions (marked by gray bars) and rate cuts (noted with red stars).
Table. S&P 500 Price Returns following Initial Fed Rate Cuts
Initial Fed Rate Cut | 1-Month Return | 3-Month Return | 6-Month Return | 12-Month Return |
6/14/1960 | -3.09% | -4.27% | -1.85% | 13.94% |
4/4/1967 | 5.72% | 1.89% | 8.08% | 5.18% |
11/9/1970 | 5.75% | 15.16% | 21.50% | 11.56% |
12/9/1974 | 8.49% | 28.51% | 39.04% | 33.08% |
5/28/1980 | 3.52% | 8.94% | 25.40% | 19.09% |
11/7/1984 | -4.08% | 7.48% | 6.85% | 13.86% |
6/5/1989 | -0.43% | 9.48% | 8.56% | 13.85% |
7/6/1995 | 0.89% | 5.14% | 11.32% | 18.67% |
9/29/1998 | 3.52% | 18.38% | 24.89% | 20.91% |
1/3/2001 | 0.14% | -17.89% | -8.39% | -13.53% |
9/18/2007 | 1.34% | -4.26% | -12.44% | -20.61% |
7/31/2019 | -1.81% | 1.92% | 8.23% | 9.76% |
Median | 1.11% | 6.31% | 8.39% | 13.86% |
Average | 1.66% | 5.87% | 10.93% | 10.48% |
% Positive | 67% | 75% | 75% | 83% |
Source: Yahoo Finance S&P 500 Historical Price Data and Federal Reserve Board | ||||
Chart. S&P 500 Historical Price Return (1960-Present) and Initial Fed Rate Cuts
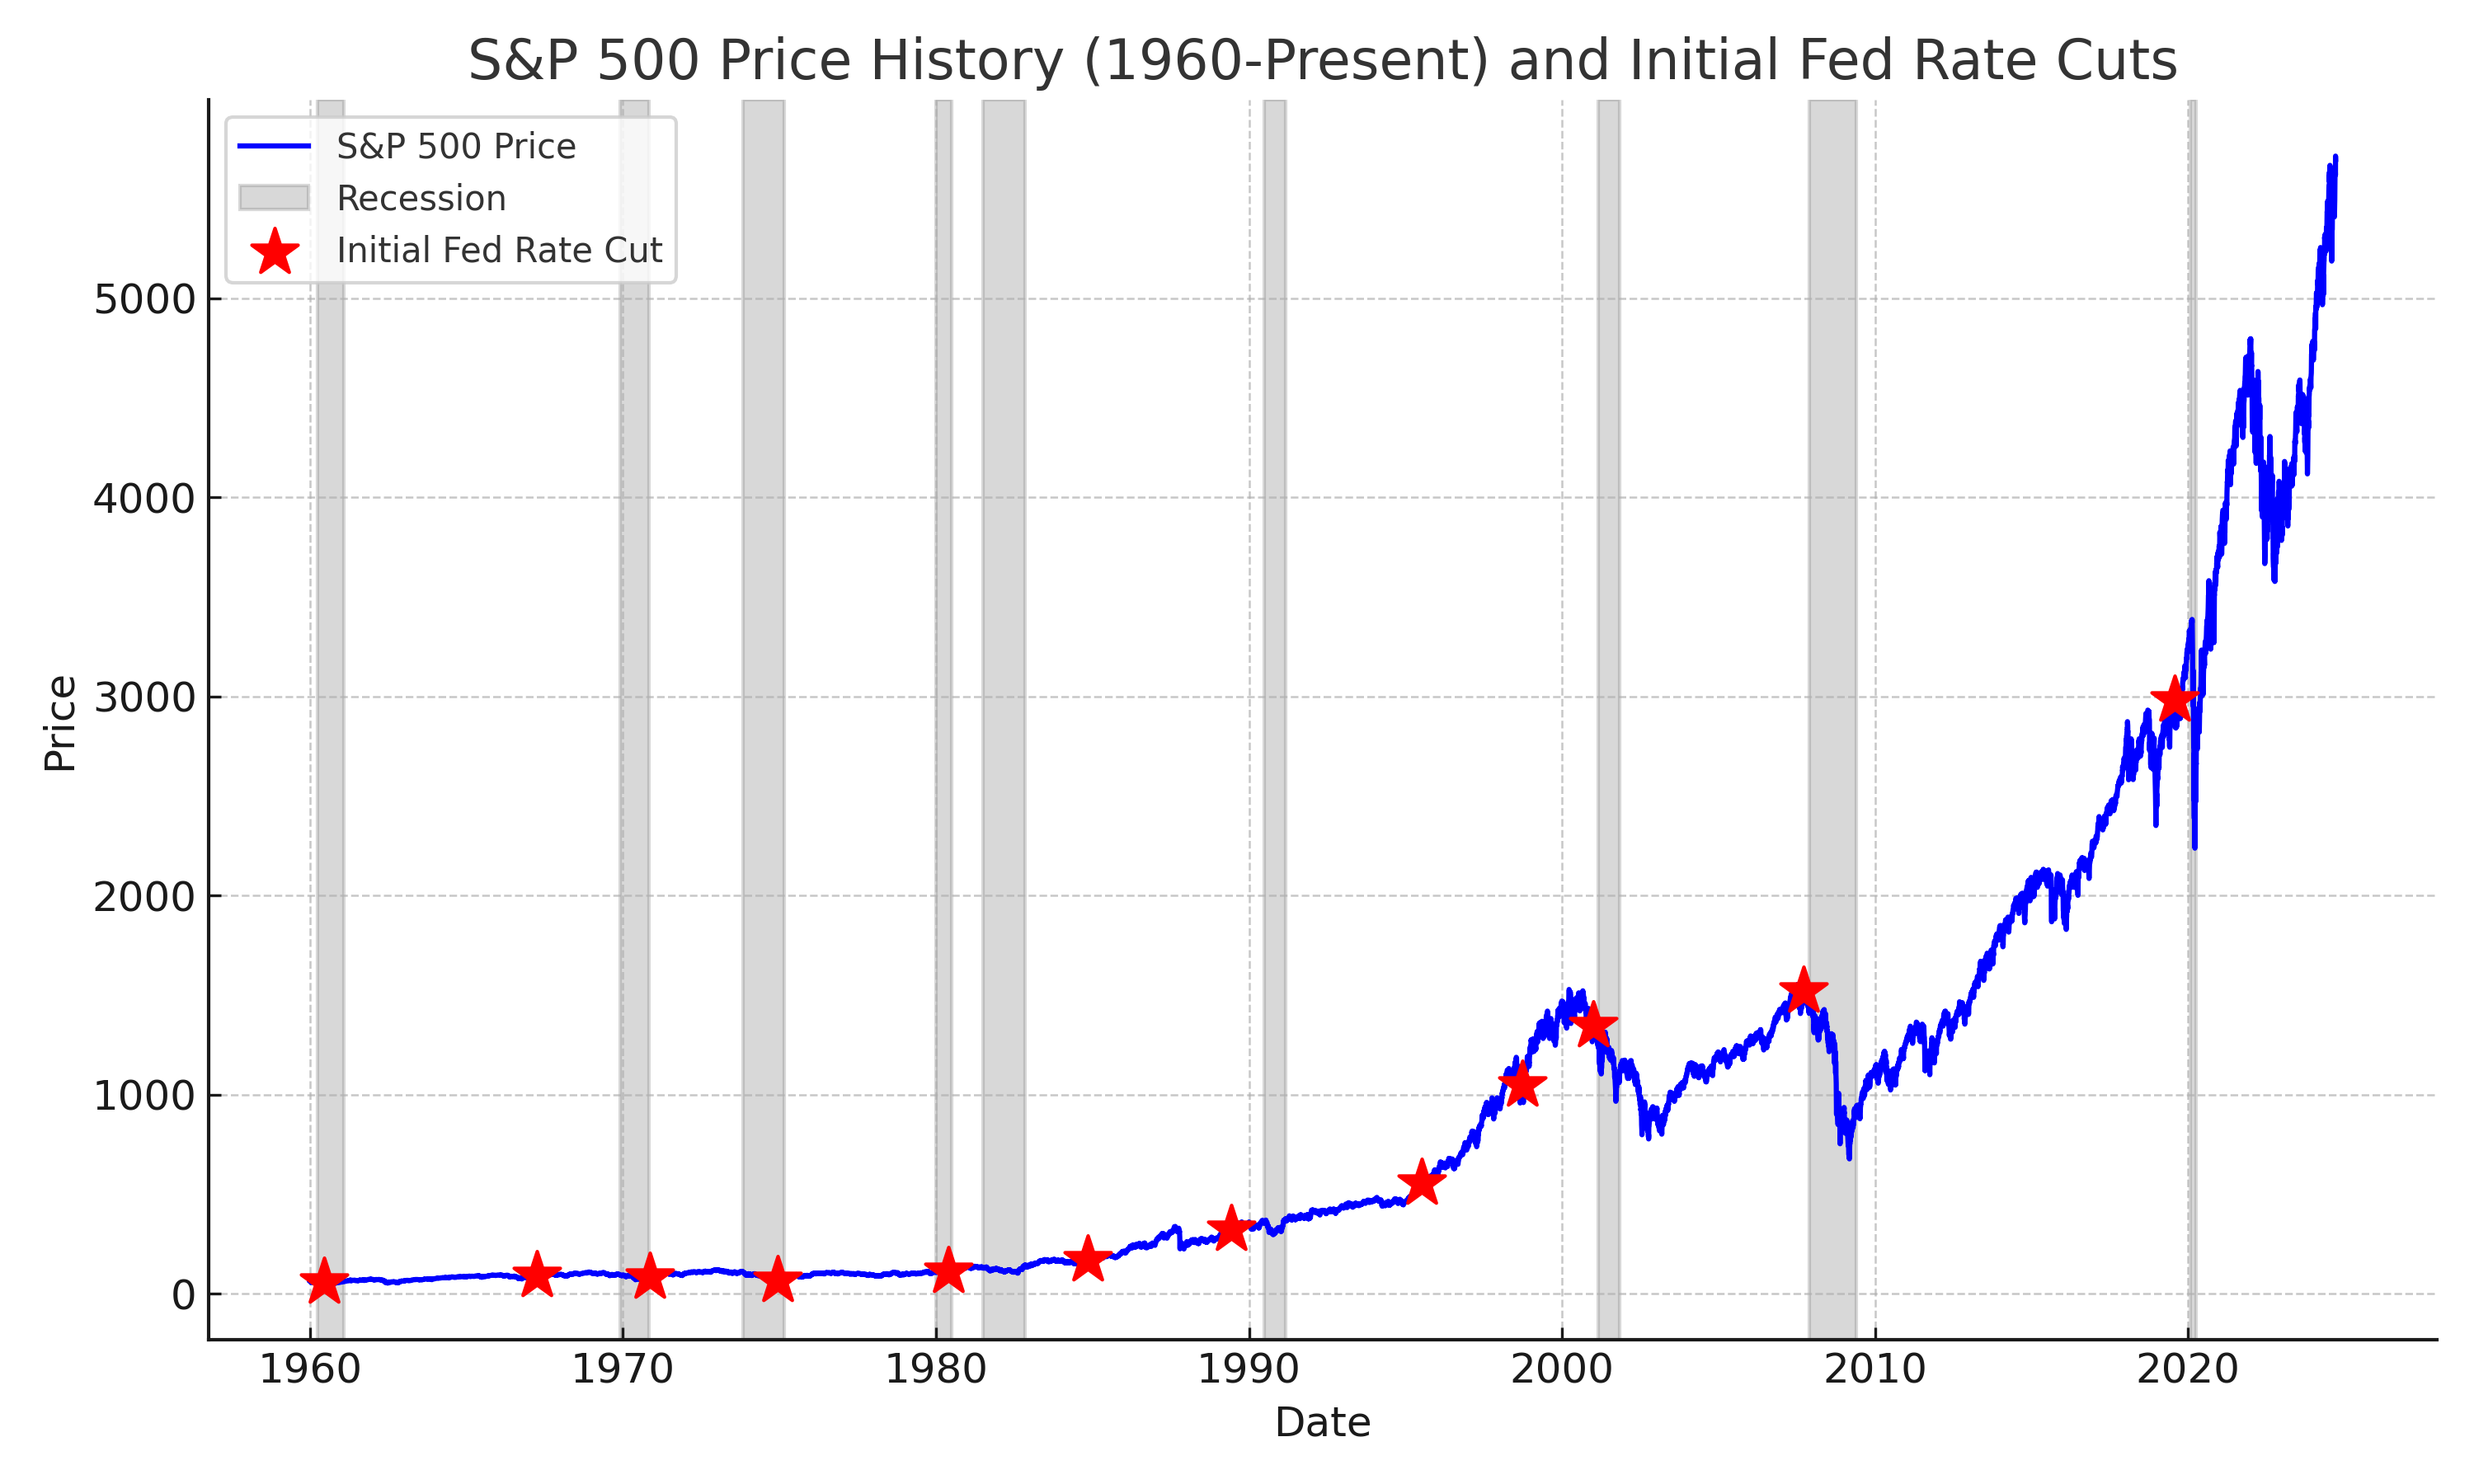
Source: Yahoo Finance, Federal Reserve Board and National Bureau of Economic Research
As the data shows, there is no single, consistent outcome when the Federal Reserve begins to lower interest rates. However, some key trends emerge that investors should note:
Positive Market Reactions:
Historically, the S&P 500 has produced favorable long-term returns after initial rate cuts. The average return 12 months following a rate cut is 10.48%, with an 83% probability of positive returns. This highlights the market’s resilience and its tendency to recover after rate cuts, especially for long-term investors.
Not All Rate Cuts Lead to Recessions:
While some rate cuts have preceded major economic downturns (notably in 2001 and 2007), many have not. For example, rate cuts in 1967, 1984, 1995, and 1998 were followed by robust market growth and did not lead to recessions. This suggests that rate cuts do not inherently signal a recession; rather, their impact on markets depends on the broader economic environment at the time.
Current Environment for Rate Cuts
We believe that the recent rate cut is more of a recalibration or mid-cycle adjustment rather than a signal of impending recession. Several key factors suggest that the current economic backdrop is favorable for future market performance:
Inflation Easing Without Weakening Growth: Unlike past rate cuts that were implemented during periods of rising inflation or slowing economic activity, this rate cut comes at a time when inflation has come down near the Fed’s target, without significantly weakening growth. This creates an ideal environment for a rate cut to act as a mid-cycle adjustment rather than a reactive measure to combat economic distress.
High Productivity: U.S. labor productivity remains strong, enabling businesses to maintain profitability, reduce inflationary pressures and support economic growth. Enhanced efficiency allows employers to offer higher wages without increasing costs, which in turn improves living standards as consumers gain greater purchasing power.
Healthy Balance Sheets: Households and businesses are financially strong. The household debt service ratio remains low, providing consumers with greater flexibility. At the same time, corporations are generating $3.47 trillion in net cash flow as of Q2 2024[1], helping keep corporate debt spreads both stable and low. This reflects investor confidence in corporate creditworthiness, indicating solid balance sheets and resilience to economic challenges.
Expanding Liquidity: M2 money supply growth turned positive in March 2024 after being in contraction since November 2022[2], signaling improving liquidity in the financial system. Additionally, money market funds now hold over $6.5 trillion, far exceeding the pre-pandemic level of just over $4 trillion[3]. This combination of rising money supply and record cash reserves provides a strong foundation for investment and market growth as rate cuts make equities and other assets more appealing.
Resilient Consumer Spending: Consumer spending, which makes up roughly 70% of the U.S. economy, remains solid. While retail sales have moderated, they continue to grow, indicating that consumers remain a key driver of economic growth.
Strong Corporate Earnings: Despite global economic challenges, corporate earnings have remained strong, providing support for stock prices and overall market performance. According to FactSet, analysts forecast 3rd quarter 2024 earnings growth of 4.6%, with a solid 15.2% growth projected for 2025[4].
Solid GDP Growth: The Atlanta Fed’s GDPNow model projects 2.9% GDP growth for Q3 2024[5]. This growth suggests the economy is expanding and is well-positioned to absorb rate cuts, potentially using them to accelerate future economic activity.
All of these factors—high productivity, healthy balance sheets, expanding liquidity, resilient consumer spending, solid earnings, and strong GDP growth—form a positive environment for the economy and markets. These strong fundamentals can help amplify the effects of the Fed’s rate cuts, leading to increased borrowing, investment, and consumer activity. When liquidity is flowing, businesses are healthy, and consumers are spending, the market is likely to perform well, and the risk of a significant economic contraction is minimized.
Risks to Monitor: Unemployment and Labor Market Weakness
While the overall economic backdrop is positive, it’s important to recognize potential risks on the horizon, particularly within the labor market. Although unemployment remains relatively low, there are early signs that job growth may be slowing. A softening labor market presents risks to consumer spending and corporate profits, both of which are crucial to stock market performance.
Should unemployment begin to rise, it could lead to reduced consumer confidence and spending, weakening one of the primary drivers of economic growth. A slowdown in consumer demand could also put pressure on corporate earnings, which have been a strong pillar of market resilience thus far. Although this is not our base case scenario, it is a development that we will continue to monitor closely in the months ahead.
What Should Investors Do?
While market reactions to Federal Reserve rate cuts can vary in the short term, the S&P 500 has typically responded positively over time. Periods of volatility—especially during election seasons or in the face of broader economic disruptions—are inevitable. However, the market’s long-term upward trajectory has consistently rewarded patient investors.
The current environment—marked by high productivity, healthy balance sheets, liquidity expansion, and strong consumer spending—creates a favorable foundation for the Fed’s recent rate cut. By focusing on long-term goals and maintaining a diversified strategy, investors can navigate this period of uncertainty with confidence.
Content in this material is for general information only and not intended to provide specific advice or recommendations for any individual. All performance referenced is historical and is no guarantee of future results. All indices are unmanaged and may not be invested into directly.
All investing involves risk including loss of principal. No strategy assures success or protects against loss. There is no guarantee that a diversified portfolio will enhance overall returns or outperform a non-diversified portfolio. Diversification does not protect against market risk.
The economic forecasts set forth in this material may not develop as predicted and there can be no guarantee that strategies promoted will be successful.
[1] U.S. Bureau of Economic Analysis, Corporate Net Cash Flow with IVA [CNCF], retrieved from FRED, Federal Reserve Bank of St. Louis; https://fred.stlouisfed.org/series/CNCF.
[2] Federal Reserve Bank of St. Louis, M2 Money Stock [WM2NS], retrieved from FRED, Federal Reserve Bank of St. Louis; https://fred.stlouisfed.org/series/WM2NS.
[3] Federal Reserve Bank of St. Louis, Money Market Funds [MMMFFAQ027S], retrieved from FRED, Federal Reserve Bank of St. Louis; https://fred.stlouisfed.org/series/MMMFFAQ027S.
[4] FactSet, "Earnings Insight," September 20, 2024, by John Butters, VP, Senior Earnings Analyst. https://advantage.factset.com/hubfs/Website/Resources%20Section/Research%20Desk/Earnings%20Insight/EarningsInsight_092024A.pdf
[5] Atlanta Federal Reserve Bank, "GDPNow," accessed September 24, 2024. Available at: https://www.atlantafed.org/cqer/research/gdpnow.