

The S&P 500 finished 2024 up over 23%, marking the second consecutive year of returns above 20%. A figure well above expectations and a testament to the resilience of equities. This impressive performance raises the question: Can this momentum continue into 2025?
In this blog post, we share our perspective on the market outlook for the year ahead and highlight the key factors we are closely monitoring. While this post includes more charts than usual, we believe they provide valuable context and help illustrate the considerations guiding our approach.
Analyst Predictions for 2025
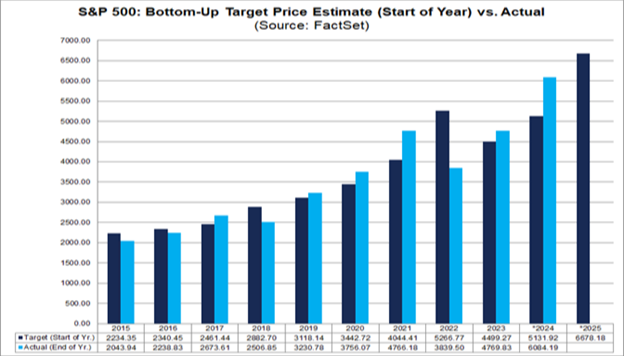
Market analysts are forecasting modest gains for 2025, with the average year-end target for the S&P 500 Index tracked by FactSet at 6,678.18, representing a projected return of approximately 9.7% for the year. However, history reminds us that predicting market outcomes over a 12-month period is inherently challenging. In 2024, for instance, analysts underestimated the S&P 500’s year-end level by 14.6%. Over the past two decades, average annual forecast errors have been 6.9%, with a tendency to overestimate returns.[1] Considering this margin of deviation, the 2025 price target suggests a potential wide range of returns between 2.8% and 16.6%.
Chart. FactSet Bottom-Up Target Price Estimates (Start of Year) vs Actual
Historical Data and Probabilities
We are approximately 2.25 years into the current bull market, which began in October 2022. As the chart below demonstrates, the trajectory of the current bull market (blue line) closely resembles the average post-war S&P 500 bull market (red line) during its early stages. The data suggests that while the third year of a bull market often sees positive returns, they tend to be more subdued, with heightened volatility and an increased probability of corrections.[2]
Chart. Current Bull Market vs. Average Post-War Bull Market First 3 1/4 Years
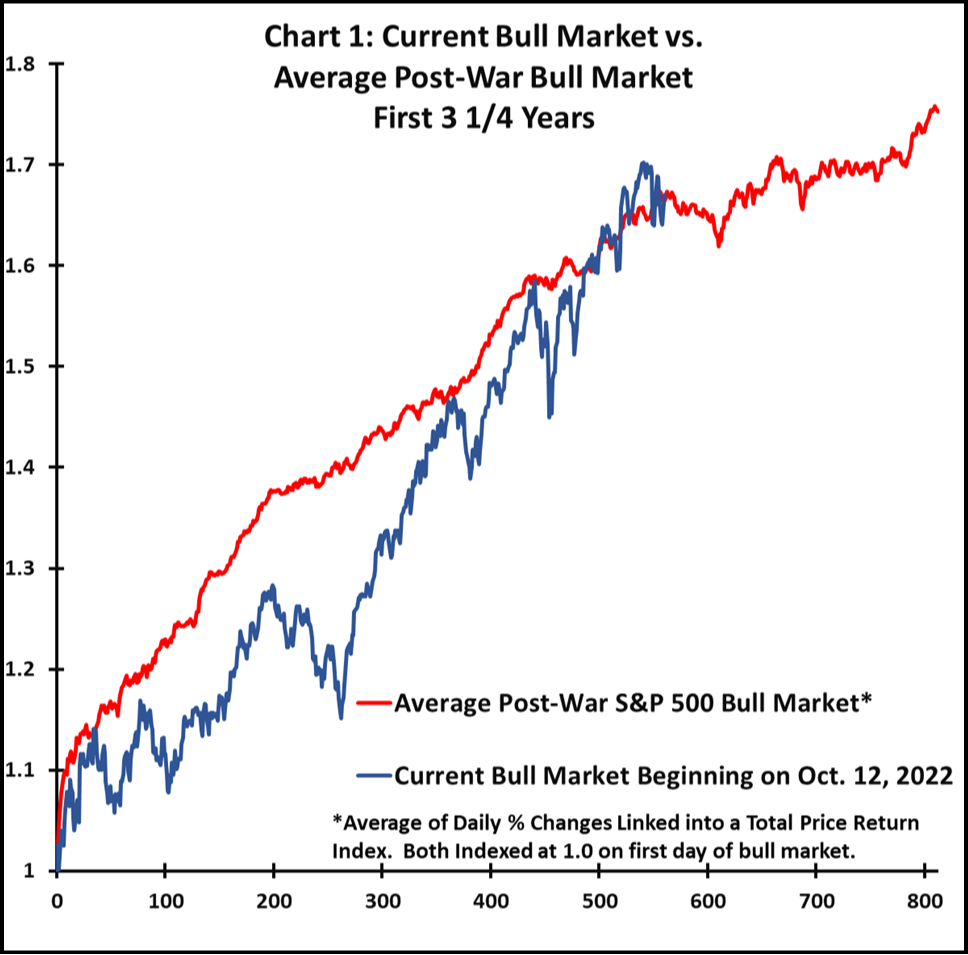
Chart Source: Paulsen Perspectives
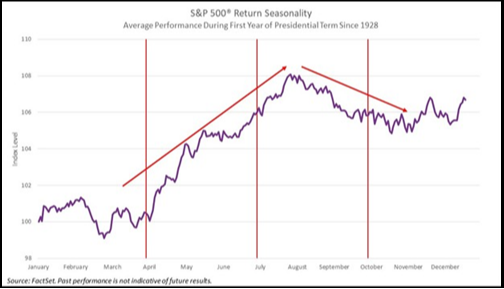
Additionally, 2025 marks the first year of a new presidential cycle. Historically, the S&P 500 has demonstrated seasonal patterns during these years, with stronger performance typically concentrated in the first half. As seen in the chart below from Natixis Investment Management and FactSet, the latter half of the year often experiences increased volatility, reflecting the challenges and uncertainties inherent in new administrations' policy adjustments. Despite this volatility, average returns during the first year of a new presidential cycle remain positive overall.
Chart. Average Performance During First Year of Presidential Term Since 1928
Taken as a whole, these insights underscore the importance of viewing short-term market fluctuations within the context of long-term trends. Since 1928, the S&P 500 has delivered positive annual returns 73% of the time, while negative years—accounting for 26%—are often linked to recessions or significant external shocks.[3] This reinforces the importance of maintaining a long-term perspective, even when navigating periods of short-term market turbulence. On average, the market experiences drawdowns of 5%-10% three times per year, while more substantial corrections of 10%-20% typically occur once annually.[4] Volatility is an inherent feature of investing, not an anomaly. Historical evidence consistently shows that staying invested increases the probability of achieving positive outcomes over time. Please see our blog post, The Power of Patience in Investing, for additional information about historical long-term returns.
Key Drivers for 2025
Inflation Trends
Inflation remains a critical factor influencing market performance as we move into 2025. In late 2024, inflation readings plateaued, with November’s year-over-year Consumer Price Index (CPI) rate standing at 2.7%. This stabilization suggests that the aggressive inflation seen in previous periods is easing, providing a more predictable environment for both consumers and investors.
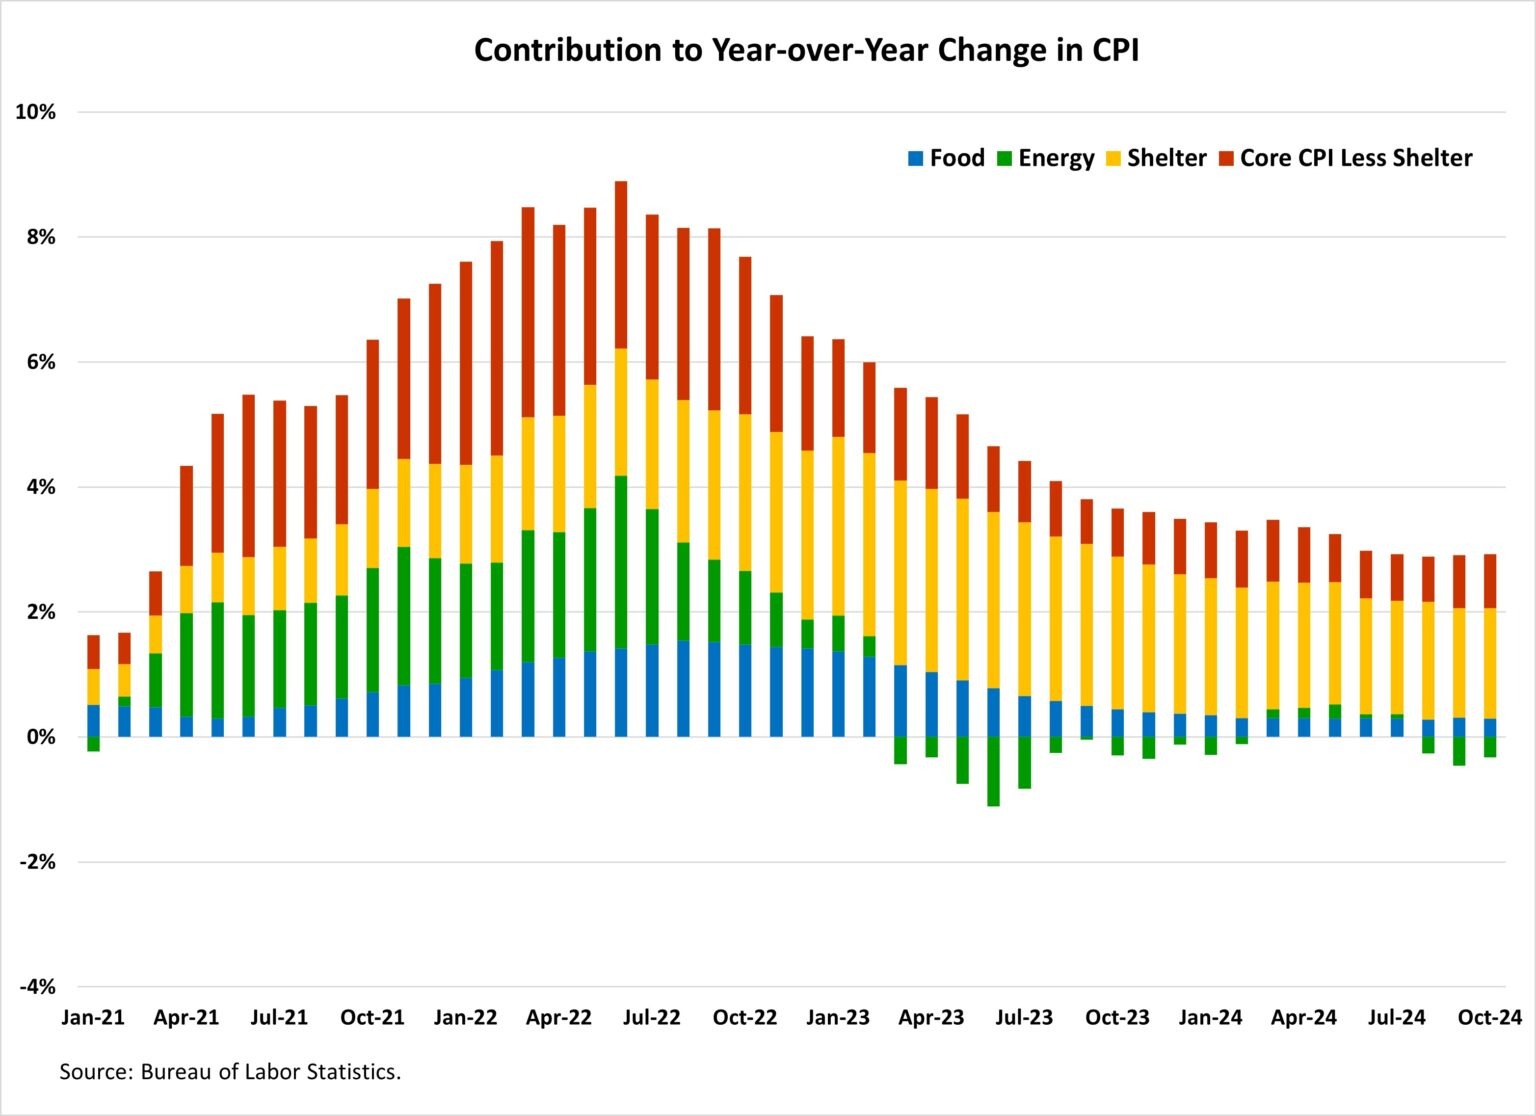
As shown in the chart below, shelter costs (yellow) have played a disproportionately large role in recent inflation figures. In October and November 2024, shelter costs accounted for over 50%[5] and nearly 40%[6] of the CPI increases, respectively. While shelter costs remain elevated, other components of the CPI, such as energy (green) and core goods and services excluding shelter (red), are showing signs of disinflation. This broader easing across categories indicates that inflationary pressures are becoming more contained.
Chart. Contributions to Year-over-Year Change in CPI (January 2021 – October 2024)
Interest Rates and Federal Reserve Policy
The Federal Reserve’s recent decision to initiate rate cuts in late 2024 marks a critical shift in monetary policy. However, as shown in the chart, the federal funds rate (gray line) remains above the Personal Consumption Expenditures (PCE) Price Index annual change (blue line), indicating that interest rates are in restrictive territory. This means that the cost of borrowing remains elevated relative to inflation, which could slow economic activity and temper inflationary pressures.
Chart. US Federal Funds Rate and US 10-YR Treasury Rate vs PCE Index Annual Change
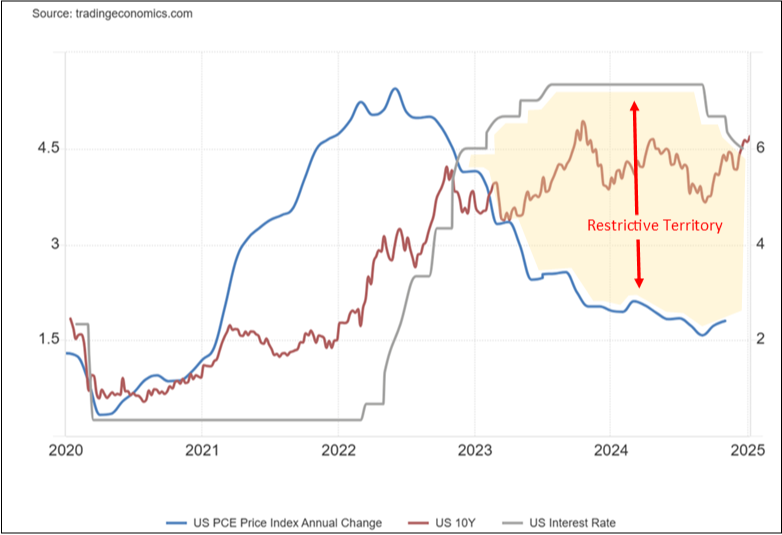
Additionally, the chart highlights the movement of the 10-year Treasury yield (red line), which has remained elevated alongside the Fed’s restrictive interest rate policy. As the Federal Reserve continues to lower interest rates, downward pressure on the 10-year Treasury yield is expected. Historically, declining long-term yields have been favorable for markets, as they reduce borrowing costs for corporations and individuals, improve valuations for equities, and support broader economic activity.
The restrictive stance of the federal funds rate underscores the Fed's cautious approach to balancing inflation control with the need to foster economic growth. Historically, rate cuts in non-recessionary periods have provided a strong tailwind for equities, with the S&P 500 averaging gains of 27.9% during such cycles.[7] In contrast, rate cut cycles during recessions do not fare as well, producing an average return of -3.8%. This historical context suggests that the current policy shift, while restrictive, holds the potential for positive market outcomes if the economy avoids a recession.
Corporate Earnings Strength
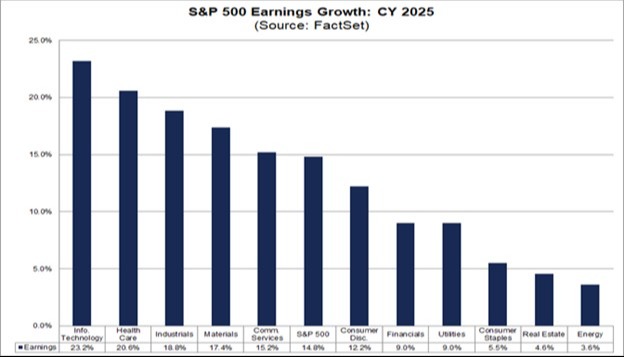
Corporate earnings growth is poised to be a key pillar for 2025, with analysts projecting a robust 14.8% increase—well above the 10-year average of 8%.[8] This broad-based growth reflects the resilience and adaptability of corporate America.
Chart. FactSet 2025 S&P 500 Earnings Growth Estimates by Sector
Other Risks and Opportunities
While the 2025 outlook is constructive, several risks warrant attention:
- Consumer Spending Slowdown: Shifts in spending habits could weigh on economic momentum.
- Geopolitical Uncertainties: Global events remain a source of potential volatility.
- Resurgent Inflation: External factors, such as tariffs, could reignite inflationary pressures.
- Weakening Labor Market: A softening labor market could dampen consumer confidence and spending.
On the flip side, there are additional compelling opportunities:
- Supportive Policies: Fiscal and monetary policies continue to provide a favorable backdrop.
- Deregulation: Easing regulatory environment may reduce compliance costs, foster corporate investment, and boost profitability.
- Higher Productivity: Advances in technology and innovation continue to drive higher productivity across industries, enhancing efficiency and supporting long-term corporate earnings growth.
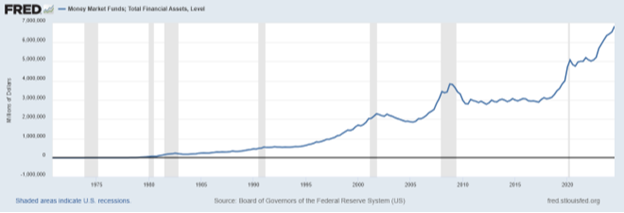
- Ample Liquidity: Near-record cash levels in money market funds, exceeding $6.5 trillion, could potentially flow into equities as interest rates decline or if investors choose to reallocate during market pullbacks.
Chart. Money Market Funds, Total Financial Assets
Conclusion
As we turn the page on a new calendar year, it’s important to remember that market dynamics don’t change overnight. The resilience shown by the S&P 500 in 2024, with its impressive 23% gain, underscores the value of staying invested.
We believe this market still has the potential to maintain its positive momentum, particularly if inflation remains under control, the Federal Reserve continues its path of lowering interest rates, and corporate earnings remain strong. While increased volatility is expected as this cycle matures, strong fundamentals and long-term opportunities reinforce the importance of staying focused on your financial goals with a disciplined and diversified approach.
Content in this material is for general information only and not intended to provide specific advice or recommendations for any individual. All performance referenced is historical and is no guarantee of future results. All indices are unmanaged and may not be invested into directly.
All investing involves risk including loss of principal. No strategy assures success or protects against loss. There is no guarantee that a diversified portfolio will enhance overall returns or outperform a non-diversified portfolio. Diversification does not protect against market risk.
The economic forecasts set forth in this material may not develop as predicted and there can be no guarantee that strategies promoted will be successful.
[1] FactSet. (n.d.). Industry analysts predict the S&P 500 will close above 6600 in 2025. FactSet Insight. Retrieved January 10, 2025, from https://insight.factset.com/industry-analysts-predict-the-sp-500-will-close-above-6600-in-2025
[2] Paulsen, J. (n.d.). The ugly, the bad, and the good: A bull market perspective. Paulsen Perspectives. Retrieved January 10, 2025, from https://paulsenperspectives.substack.com/p/the-ugly-the-bad-and-the-good-a-bull
[3] Damodaran, A. (n.d.). Historical returns on the S&P 500. NYU Stern School of Business. Retrieved January 10, 2025, from https://pages.stern.nyu.edu/~adamodar/New_Home_Page/datafile/histretSP.html
[4] LPL Financial. (n.d.). More pullback perspective. Retrieved January 9, 2025, from https://www.lpl.com/research/blog/more-pullback-perspective.html
[5] Yahoo Finance. (n.d.). October inflation data meets forecasts, keeping Fed on track for December rate cut. Yahoo. Retrieved January 9, 2025, from https://finance.yahoo.com/news/october-inflation-data-meets-forecasts-keeping-fed-on-track-for-december-rate-cut-133141995.html
[6] J.P. Morgan. (n.d.). Breaking down the November 2024 CPI report. Retrieved January 9, 2025, from https://www.jpmorgan.com/insights/outlook/economic-outlook/cpi-report-november-2024#:~:text=percent%20inflation%20target.-,Breaking%20down%20the%20headline%20CPI,it%20was%20ignited%20in%202021
[7] Capital Group. (2024). 2025 outlook: Investment implications and strategies to consider. Retrieved from Capital Group 2025 Outlook Digital Edition.
[8] FactSet. (n.d.). S&P 500 CY 2025 earnings preview: Analysts expect earnings growth of 15%. Retrieved January 9, 2025, from https://insight.factset.com/sp-500-cy-2025-earnings-preview-analysts-expect-earnings-growth-of-15